
The main declared objective of the EU cohesion policy since 2004 has been the reduction of social, economic and regional differences. But how successful has it been?
“If you think in terms of a year, plant a seed, if in terms of ten years, plant trees, if in terms of 100 years, teach the people.” (Confucius, 551-497 BC)
Striving for sustainability cannot wait too long. Countries all over the world are experiencing the effects of climate change, although in different forms of environmental disasters and their human consequences. Sustainability should not, however, be limited to environmental issues. Sustainability should be viewed as holistically interlinked circles of economic, human and social factors covering issues such as inequality and the gap between developed and less developed countries. The UN has developed the 17 sustainable development goals (SDGs) with the related 169 targets. 193 member states signed the document in 2015 in which they promised to achieve the goals by 2030. The EU started monitoring progress towards the SDGs in an EU context in 2017. In the introduction to the 2017 Report, Frans Timmermans, then first Vice-President of the European Commission, already emphasized the issues of climate change and growing inequalities, which needed urgent action.
In the fourth edition, entitled “Sustainable Development in the European Union, 2020” and published in May 2020, Paolo Gentiloni, the Commissioner responsible for the economy, also emphasizes in his foreword the need to tackle the problems of climate change and growing social and economic inequality, of course beyond the crisis created by the Covid-19 pandemic. It looks as if the year 2017 Report’s key points are still the main issues today.
The 2020 edition covers around 100 indicators which the researchers considered to be important from an EU perspective. The EU SDG indicator set is not, however, absolutely identical with the original UN list of goals. The weakest point of the Report is that although the large gap in human and social indicators is well illustrated, it is not connected to the characteristics of economic structures, and the large effects of global value chains on the economic structure in the less developed countries. The Report also does not analyze why human and social progress is rather slow in the countries which joined the EU 17 years ago.
Economic Structures and their Impacts on Inequalities
The EU Report is a 366 page long document which is based on the freshest available Eurostat data. Brief member states overviews are also offered at the end, but are very general, without concrete recommendations for action. Beyond the member states of the EU, the UK and for some indicators other European countries, such as Switzerland and Norway, or candidate countries, such as Albania, Serbia or Turkey are also included in the Report.
In this paper, however, I only concentrate on the performance of the EU member countries calling attention to differences among the developed and less developed member states for selected important social indicators. I also try to find relationships between indicators, as the Report does not analyze interlinkages, or causes and effects and correlations among the selected indicators. A good example is the evident connection between industrial activities, increased transportation needs and air pollution. We see the data, but the causes are not explored. But how can problems be solved if we do not analyze their roots?
To improve the situation we need honest analysis, determining the business related roots of the problems. Otherwise, the coming future reports will be stating the same problems again and again instead of demonstrating the results achieved in decreasing social and economic inequality, and mitigating triggers of climate change in every country. This paper highlights a few typical indicators and provides, apart from analysis, also EU actions, for example policy changes which are needed based on the evident cause-effect relationships and correlations.
It can be agreed that the personal fulfillment and well-being emphasized in the EU are related to the types of jobs available in an economy, and the salaries and wages they provide.
The selected indicators demonstrate the problems of economic structures and their impacts on inequality, living standards and environmental performance. It can be agreed that the personal fulfillment and well-being emphasized in the EU are related to the types of jobs available in an economy, and the salaries and wages they provide. The types of jobs available also influence social inequality and inclusion.
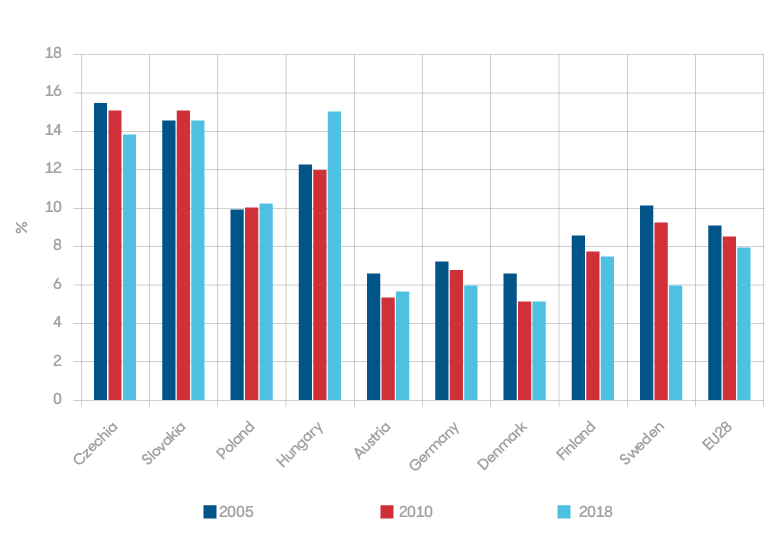
As the Report itself highlights it is not enough to generate just any kind of job. They have to be ‘decent jobs’, offering a fair income and social protection. Economic data show that in the less developed economies of the EU a large proportion of the assembly operations of mostly EU multinationals and other businesses dominate the economic structure. This is also mirrored in the employment structure as can be seen in Figure 1.

Figure 1. Employment of plant and machine operators and assemblers in 2005, 2010, 2018 in the 15-64 age range (%) Source: Eurostat
Low value-added jobs are growing
Figure 1 indicates that low value-added jobs are extensive in the employment structure in Eastern countries. It has even been growing in Poland and Hungary from 2005 to 2018. These jobs are multi-shifts and poorly paid jobs, not contributing to decreasing inequality and not increasing inclusion, or human self-fulfillment. This also means that these foreign controlled local assembly operations do not invest in local knowledge creation, as can be observed in Figure 2.
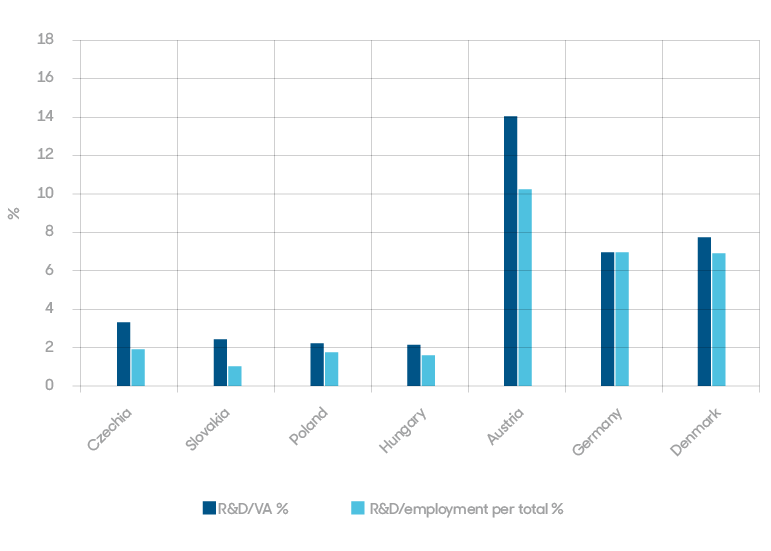
Figure 2. R&D expenditure as percentage of value added, and R&D employment as percentage of the total persons employed in foreign controlled enterprises (2017, %) Source: Eurostat
The differences are striking: in Austria R&D, as a percentage of business value added in the foreign controlled enterprises is seven times higher than in Hungary.
How can we describe then the impact of these businesses on local human development? Do these businesses really care about creating ‘decent’, well-paid jobs, or are they actually only interested in minimizing local costs? How do the operations of these businesses converge with the important EU goals of “shared prosperity and good enough living standards for every EU citizen” emphasized in the Report? These companies may also enjoy less strict environmental regulations.
One typical example was when a car manufacturer in Hungary was allowed to build an assembly plant on a Natura 2000 site. Since then, several businesses, operating mostly in the car manufacturing value chains, turned farmland into concrete by building assembly plants or logistics centers. These are proudly called ‘green field investments’ in Hungary. A fresh example is the BMW green field investment in the eastern part of Hungary, which is also built on farmland and which also involved a great deal of Hungarian taxpayers’ money. These types of economic decisions restrict improving human and environmental sustainability faster than in the less developed countries. The EU is silent, however, about these issues, in all probability because these local state policy decisions serve business interests, among them those of European multinationals.
Green field investments restrict improving human and environmental sustainability faster than in the less developed countries. The EU is silent, however, about these issues.
Let us now turn to some warning human and environmental indicators from the Report!
The Role of the repatriated profit
As can be seen in Figure 3. change in actual GDP per capita is attractive in the Eastern part of the EU, but what really matters from the point of view of “shared prosperity” and “good enough living standards”, is the purchasing power (Figure 4) and the disposable income of households (Figure 5), data which exhibits significant differences between countries of the Eastern and Western part of the EU.
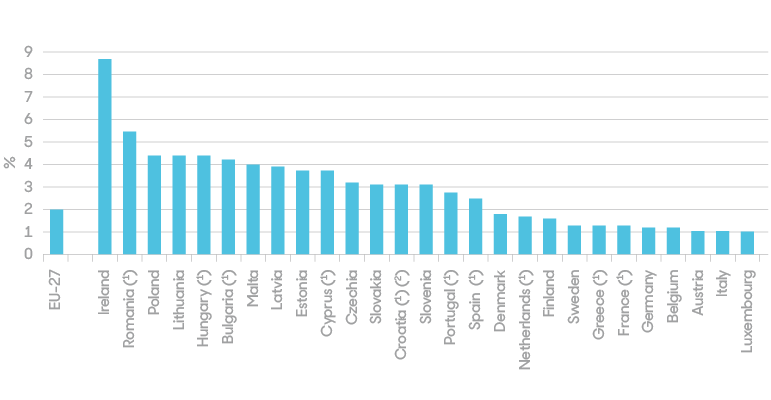
Figure 3. Change in actual GDP per capita, by country, 2014-2019 (average annual growth rate in %) Source: The EU Report
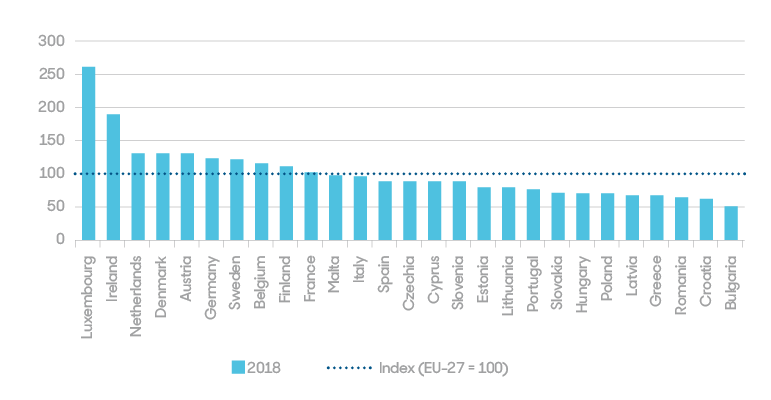
Figure 4. Purchasing power adjusted GDP per capita, by country, 2018 (index EU27=100) Source: The EU Report
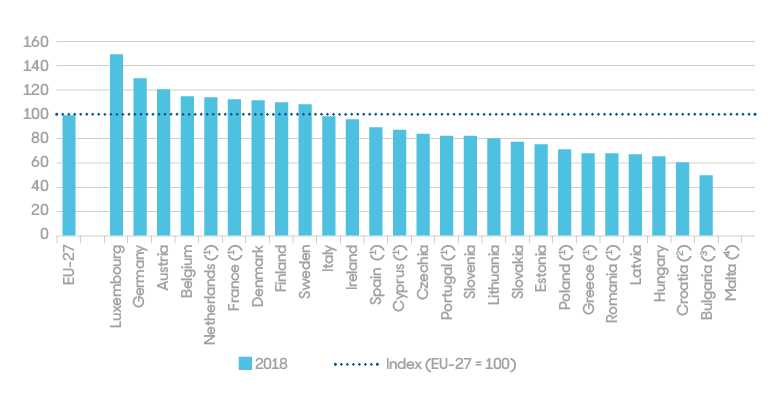
Figure 5. Adjusted gross disposable income of households per capita, by country, 2018 (Index EU27=100) Source: The EU Report
What is the explanation for this phenomenon? Why is convergence in living standards so slow in the Eastern part of the EU? Why don’t GDP growth results translate into better living standards data? What is the role of the repatriated profit, earned in the countries with foreign assembly operations and taken back home? As we know from statistics, the repatriated profit data are included in the GDP, but do not show up of course in the income and purchasing power data of the local households. Attention should also be drawn to the very disturbing data in Figure 6.
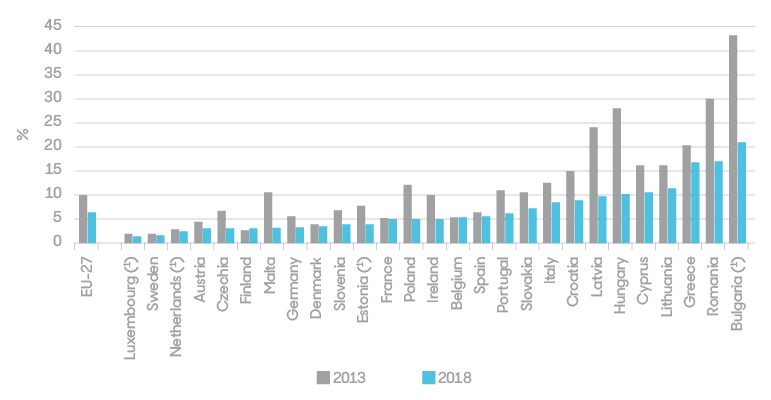
Figure 6. Severely materially deprived people, by country, 2013 and 2018 (% of population) Source: The EU Report
The Role of the Repatriated Profit
The Report makes mention of the intention of the EU to achieve shared prosperity and solid basic living standards for all EU citizens. The figures, however, indicate that in the Eastern part of the EU – with the exception of Czechia – the percentage of severely deprived people, even in 2018, 17 years after becoming EU members, is much higher than the EU average. In the case of Bulgaria it is four times higher, and this is just the country-average. Regional differences are probably much higher. Why is the rapid GDP growth not reflected here?
It is also striking how large the gap is in terms of avoidable mortality (Figure 7) and life expectancy (Figure 8) in the Eastern and Western parts of the EU, 17 years after the EU enlargement. It is worth mentioning that improvement in the data from 2011 to 2016 in the case of mortality and from 2013 to 2018 for life expectancy is also extremely slow.
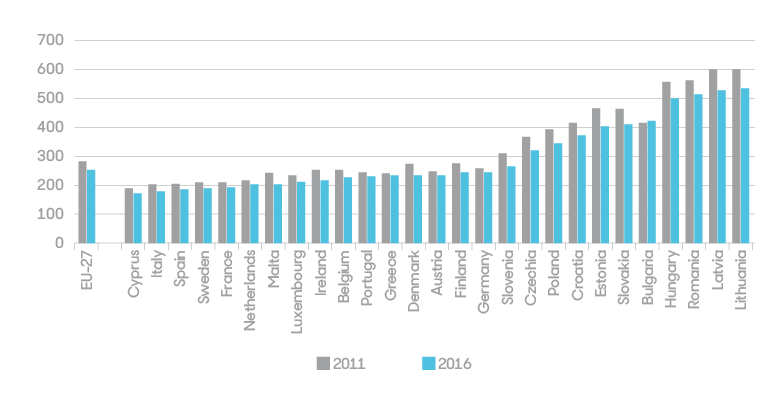
Figure 7. Standardized avoidable mortality, by country, 2011 and 2016 (number per 100,000 people aged less than 75 years) Source: The EU Report
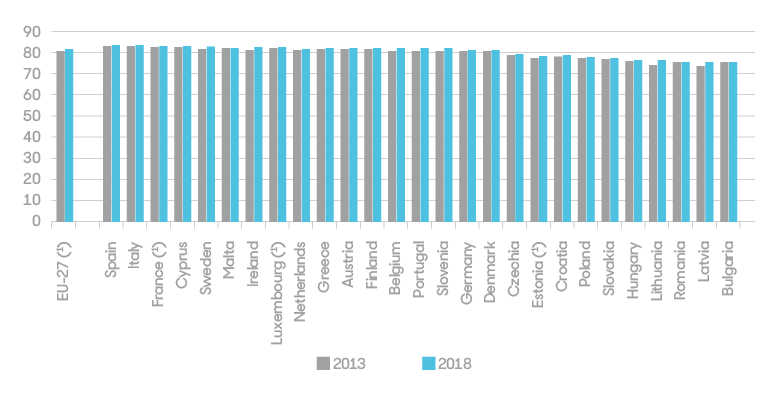
Figure 8. Life expectancy at birth, by country, 2013 and 2018 (years) Source: The EU Report
Health and life expectancy, among other things, depend on socio-economic factors, the quality of the environment, for example, air cleanliness. Figure 9 illustrates the major gap in terms of exposure to air pollution in the East and West. The most polluted 5 countries are Eastern European nations.
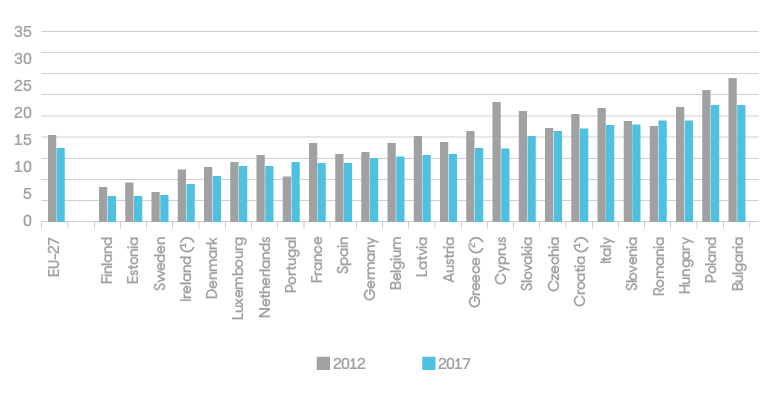
Figure 9. Exposure to air pollution by particulate matter (PM2.5) by country, 2012 and 2017 (µg/m3) Source: The EU Report
Close Relationships Between Economic Structure and Environment
How does air pollution correlate with the increased transportation needs of the local assembly lines of the global value chains? How does increased air pollution affect health related data? These questions are not raised and analyzed in the Report.
Returning back to the economic structure and the human and environmental characteristics, it is obvious that there are close relationships between them. If the economic structure will not be upgraded and low value added activities minimized, then the presently less developed countries will lag behind the more developed ones for a long period of time. This was not supposed to be the vision when they joined the EU.
If knowledge continues to be created in the West and the East will only be the consumer of imported knowledge the region may even end up stuck in the middle development trap. This means that the less developed countries of the Eastern part of the EU, will not be able to compete in terms of innovation and knowledge, but will remain a location for low value added operations of businesses from the developed countries. This will also determine living standards, human fulfillment and social sustainability. As can be seen in the Figures, there are already signs of lagging human and environmental achievements.
If knowledge continues to be created in the West and the East will only be the consumer of imported knowledge the region may even end up stuck in the middle development trap.
We can also raise the related question as to why patent application, which is an indicator of local knowledge creation, is almost non-existent in the Eastern part of the EU? How does this phenomenon coincide with the nature of business activities, the present economic structure and the large share of assembly operations?
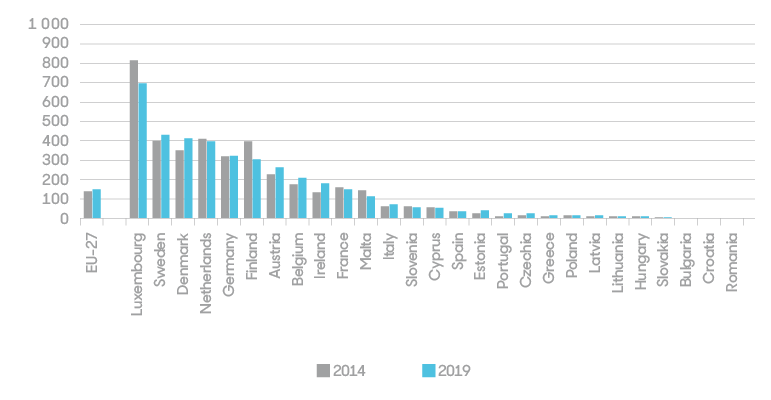
Figure 10. Patent applications to the European Patent Office, by country, 2014 and 2019 (per million inhabitants) Source: The EU Report
And what happens when assembly operations will be robotized while, as can be seen in Figure 11, adult participation in learning is also at a very low level in the Eastern part of the EU?
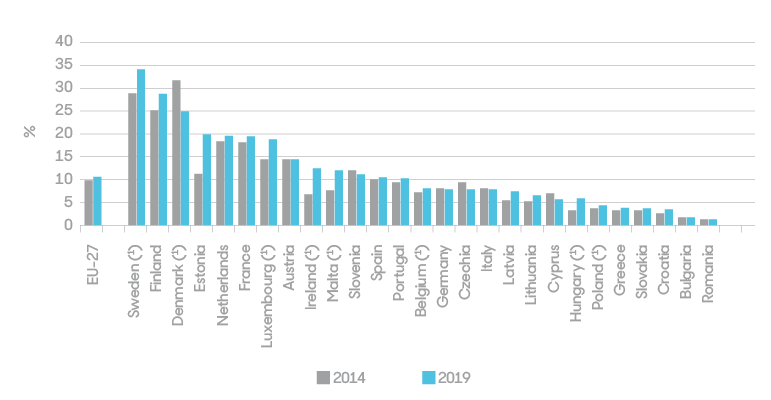
Figure 11. Adult participation in learning, by country, 2014 and 2019 (% of population aged 25 to 64) Source: The EU Report
A Sharp Contrast 17 Years after EU Enlargement
The main declared objective of the EU cohesion policy since 2004 has been the reduction of social, economic and regional differences. But how successful has it been? The selected indicators indicate that there is a sharp contrast in terms of real human and environmental development even 17 years after the EU enlargement between the Eastern and Western part of the EU. This is also demonstrated by the social progress index in Figure 12.
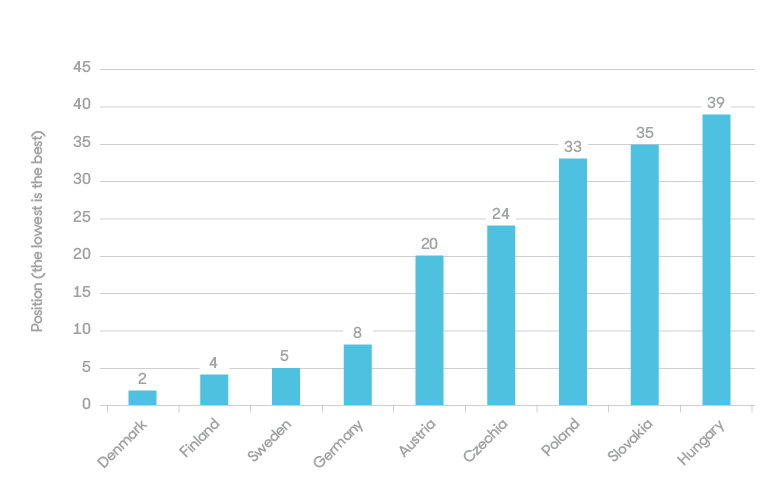
Figure 12. Social Progress Index positions 2019 (Number of countries analyzed: 149) Source: Social Progress Imperative, 2019
The EU has to face these raised dilemmas upfront and honestly, otherwise general sustainable development will be impossible to achieve. This should mean confronting wage minimization, and socially, also environmentally insensitive business behavior and interests, among other things. Business interests should not be the ruling force over building societies, which work for all people, and which also preserve the environment.
Every country in the EU should be in a position to be able to build strong national wealth, including the knowledge level and the health of the population. Young people also have to be able to find decent, high-value-added jobs in each country, instead of searching for opportunities abroad. Brain drain is a loss to the national wealth from a nation’s point of view. Profit earned should be reinvested in the location, where it was produced. It is especially important for underdeveloped regions in the less developed countries. Regional disparities, which are also typical for the EU, will deteriorate the fabric of societies and that of the EU.
Every country in the EU should be in a position to be able to build strong national wealth, including the knowledge level and the health of the population. Brain drain is a loss to the national wealth from a nation’s point of view.
Consequently, “shared prosperity” will remain only a political slogan, and the lack of convergence and general cohesion, as well as the lack of local knowledge creation and knowledge upgrading, will hurt not only the achievements of the SDGs, but the long term credibility and also economic and social competitiveness of the EU. The solution should be a comprehensive EU wide human and social development strategy which places an emphasis on human and social value creation over economic and business interests.
“In a country well governed, poverty is something to be ashamed of. In a country badly governed wealth is something to be ashamed of.” (Confucius)